Selling insurance on the stock market
What really happens to your account when you run a systematic put-selling method. Explained without jargon, with today’s real prices and seventy-six years of market history.
For anyone considering an options-trading education program
Educational document. Not financial advice, not a recommendation.
Nine chapters and a methodology note.
In one sentence: you are selling insurance against stock-market crashes.
Everything else is vocabulary. If you understand this sentence, you understand the method, its genuine merit, and its one very serious flaw.
When someone fears a market crash, they can buy protection: an instrument worth zero if all goes well and worth a fortune if disaster strikes. It is called a put option. It works exactly like the insurance on your car.
The method you are evaluating puts you on the other side of the table: you are the insurance company. You collect the premium every month. In the vast majority of months nothing happens and the premium is yours to keep. Every now and then, though, the claim arrives — and the claim is yours to pay.
The right question is not «does it work?». The answer is yes — it works, and it is a strategy genuinely used by professional investors. The right question is: when the claim arrives, does my insurance company have enough cash to pay it?
The pages that follow answer this question with numbers. Not opinions, not testimonials: the real price of an option on the market today, and the actual history of the American index from 1950 to yesterday.
One difference that matters more than any other
A real insurance company holds thousands of policies independent of one another: when a house burns down in one city, the one across the country does not burn with it. A put seller on the index holds one policy, always the same, renewed every month on the same thing. This is not the diversified insurer: it is the one that wrote every single policy on the same hurricane-exposed coastline. While the weather holds, the premiums roll in beautifully. Then the hurricane arrives.
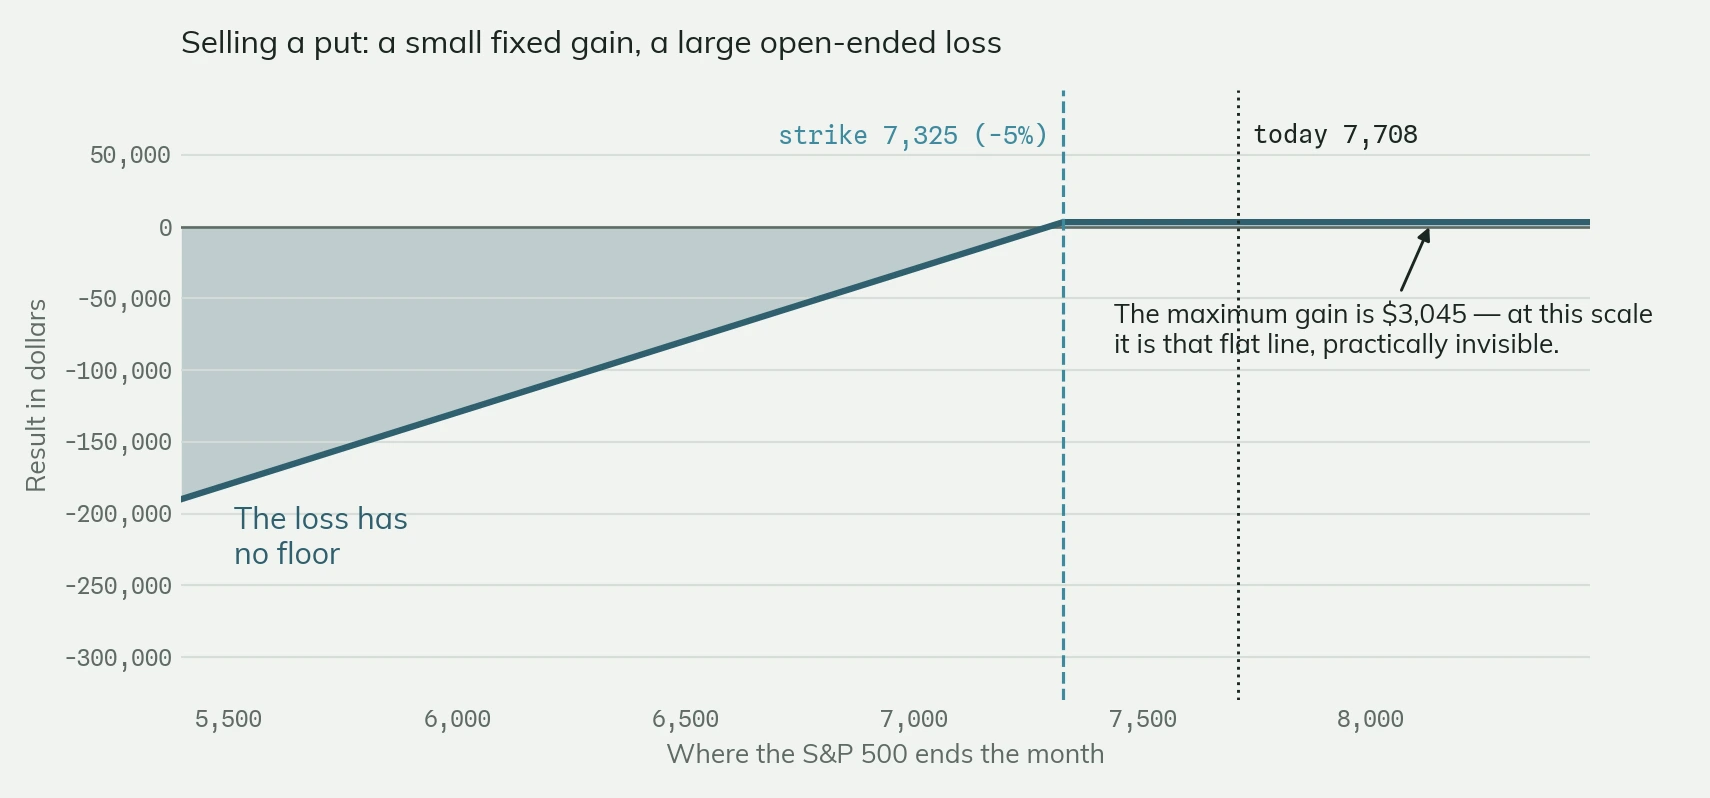
Here is exactly what you would do, and how much would land in your account.
Let’s take the real case. The S&P 500 trades at 7,708 today. The method says: sell a put option expiring in one month, at a strike price far below the market. Here is what that entails.
What you collect up front — and also the most you can ever make on the trade
The value you are insuring: the commitment you are taking on
What the broker locks up in your account as collateral
Selling one S&P 500 put, strike 6,950 — 9.8% below the current level — expiring September 17, 2026. Real market quote: bid 11.80, ask 12.10, implied volatility 24.1%, with 16,014 contracts of open interest on that line.
Read the second and third figures carefully, because that is the whole story. You have taken on a $695,000 commitment by putting $70,695 on the table. The ratio is almost ten to one. In the trade it is called financial leverage, and nobody will ever call it by that name in front of you.
Why the ten-to-one ratio matters
If the index drops 1%, the value you insured loses $6,950. But you only posted $70,695. That 1% market move does not weigh 1% on your account: it weighs ten times that. It works in both directions, with one fundamental asymmetry: on the upside your gain stops at $1,195 and never rises by a cent; on the downside there is no stop at all.
| If you pick a strike at… | Distance | You collect | They lock up | Monthly yield |
|---|---|---|---|---|
| 7,325 points | −5.0% | $3,045 | $80,367 | 3.79% |
| 7,050 points | −8.5% | $1,495 | $71,995 | 2.08% |
| 6,950 points | −9.8% | $1,195 | $70,695 | 1.69% |
| 6,750 points | −12.4% | $801 | $68,301 | 1.17% |
| 6,550 points | −15.0% | $568 | $66,068 | 0.86% |
The rule is simple and inescapable: the farther the strike, the more rarely you lose, the less you collect. There is no cell where you collect a lot and risk a little. If someone shows you that cell, it is not in the price table: it is in the sales deck.
One detail worth noticing. The VIX — the index that measures fear in the market — sits at 15.4 today: one of its lowest readings in years. When fear is low, insurance is cheap. It means you would be selling the exact same protection as always while collecting well below the historical norm. I measured it: the average over the last seventy years is 6.2% of committed capital per month; today the market pays 3.8%.
Put uncomfortably: this is one of the least convenient moments in decades to get into this business — not one of the best.
The return doesn’t come from the method. It comes from the money the broker lends you.
This is the most important chapter in the document. If you read only one, read this one.
Let’s repeat the exact same trade, with the exact same premium collected, and change one thing only: how much of your own money you post as collateral.
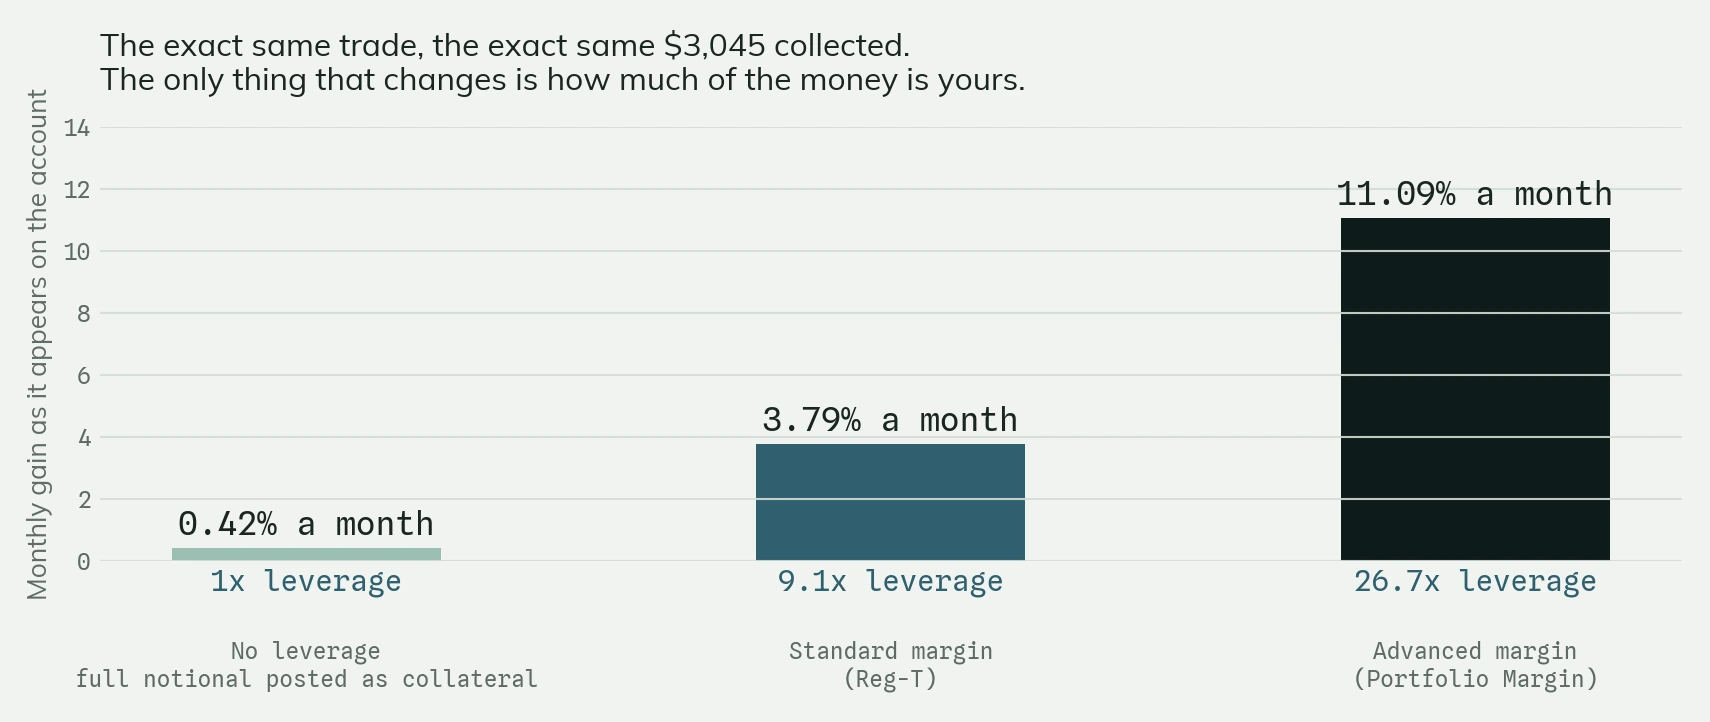
The left bar is the trade done with both feet on the ground: you post the full value you are insuring, $732,500, and you collect $3,045. That is 0.42% per month. Not a brochure number. It is, however, the true one.
The middle bar is the same trade with the margin a normal broker grants: the dollars you lock up become $80,367 and the apparent yield rises to 3.79% per month. You have not earned a dollar more. You have simply put less of your own money on the table.
The right bar is what happens with the advanced margin some brokers grant above a certain account size: $27,469 locked up, an apparent yield of 11.09% per month, and a commitment worth twenty-seven times the capital.
When someone shows you a method returning 3, 5 or 8 percent a month, they are not showing you a discovery. They are showing you 0.42% multiplied by leverage. Leverage is free, everyone knows how to use it, and it requires no course. What requires experience is surviving it.
The rule that always holds, in finance as elsewhere
Leverage is an amplifier. It creates no return: it multiplies what is there, including the negative part. If a strategy returns 0.42% a month and you multiply it by nine to make it return 3.8%, you have multiplied the bad day by nine as well. And the bad day, in this strategy, is not merely nine times as bad: it is disproportionately bad, for the reason we will see two chapters from now.
Ask whoever is selling you the method a single question: «what is the average leverage of your standard operating setup — the ratio between the notional value I insure and the capital I commit?».
It is a number, not an opinion. If you get a long answer instead of a figure, you already have your answer.
It’s true. And it is the least meaningful fact about the whole method.
The figure is trumpeted everywhere, and unlike much of what this industry claims, it is perfectly accurate. I checked: since 1950, a put sold 10% below the market expired worthless in 98.4% of months.
The point is that 98.4% is not a result: it is a definition. You picked a threshold so far away that the market almost never reaches it. There is no skill inside that number, no software, no years of research. There is arithmetic.
I offer you a bet: ninety-eight times out of a hundred I give you ten dollars, two times out of a hundred you give me five hundred. My win rate is 98%. Want to play?
The math: you win 980, you lose 1,000. The win rate was true and completely irrelevant. What matters is not how often you win: it is how much you win when you win, and how much you lose when you lose.
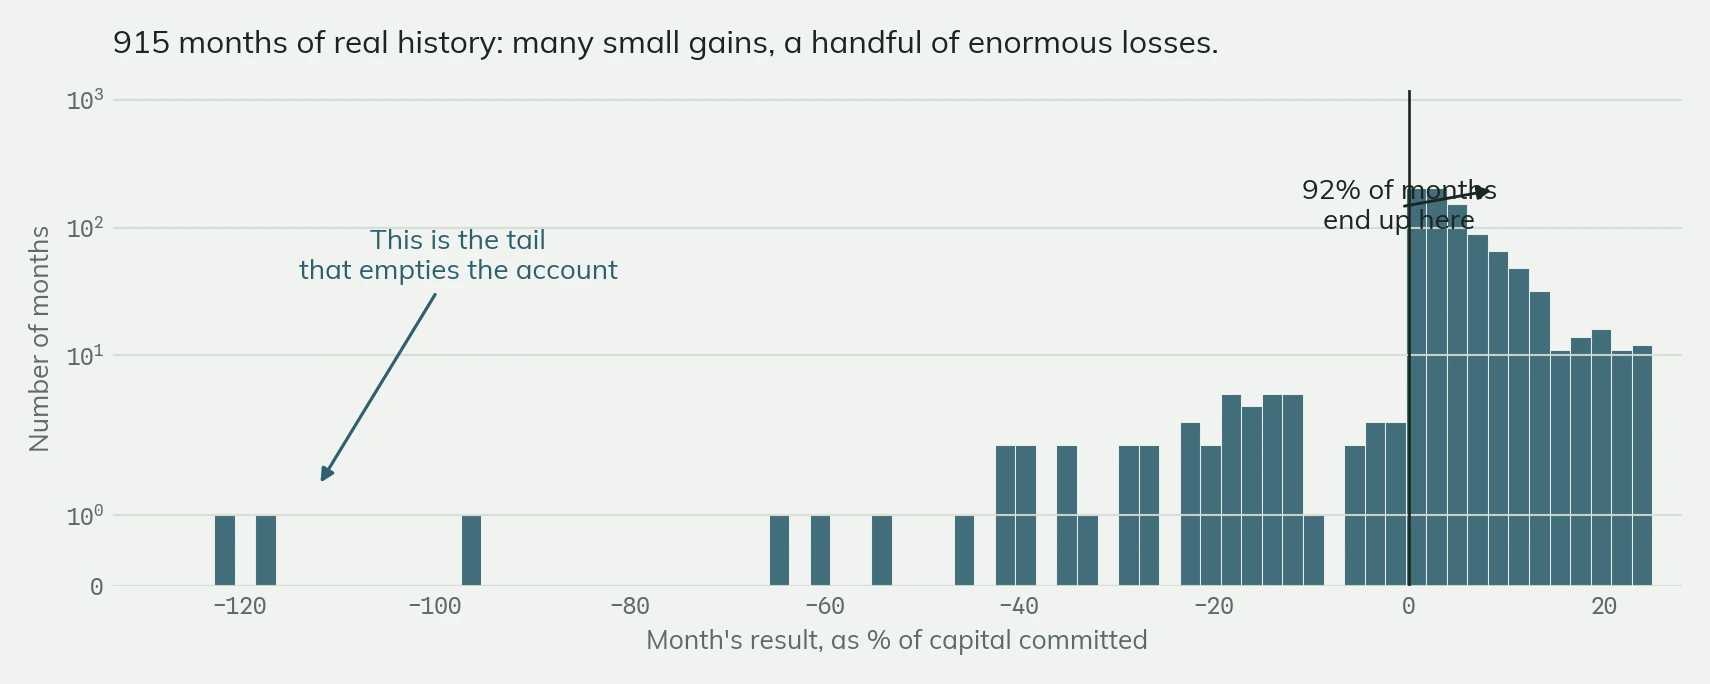
The technical name, for completeness
This shape is called negative skewness. Measured on these data it is −4.6, which in the language of statistics means «a very long left tail». Translated: the strategy produces a long, reassuring string of small wins, interrupted at irregular intervals by a single event worth more, on its own, than all the wins combined.
It is exactly why the glowing testimonials from people using these methods are, almost always, entirely sincere. The reviewers are not lying. They are simply writing before the hurricane.
Nine scenarios, with a real account moving before your eyes.
Say you have $100,000 and you sold the 7,325 put — the version that produces that 3.8% a month. It is mid-month: fourteen days to expiry. Here is what your account shows in each case.
| What the market does | Index goes to | Your account | In percent | More money needed? |
|---|---|---|---|---|
| Quiet month, index flat | 7,708 | +$2,426 | +2.4% | no |
| Index +5% | 8,093 | +$2,996 | +3.0% | no |
| Index +10% | 8,479 | +$3,042 | +3.0% | no |
| Only fear rises, VIX from 15 to 30 | 7,708 | −$4,147 | −4.1% | no |
| Index −5% | 7,323 | −$8,441 | −8.4% | yes · $29,766 |
| Index −10% | 6,937 | −$35,387 | −35.4% | yes · $77,878 |
| April 2025 replay: −12%, VIX 60 | 6,783 | −$50,654 | −50.7% | yes · $106,097 |
| March 2020 replay: −20%, VIX 70 | 6,166 | −$112,036 | −112.0% | yes · $219,612 |
| October 1987 replay: −25%, VIX 90 | 5,781 | −$150,559 | −150.6% | yes · $290,877 |
Each row reprices the option at the new index level, the new volatility and the fourteen days remaining, starting from the premium actually collected in the market. The collateral follows the standard rules for index options.
The three rows to reread
The «Index −5%» row. A five percent drop is not a catastrophe: it happens roughly once a year and makes no headlines. Yet your account loses 8.4% and the broker asks for $29,766 you do not have. An ordinary market move produces an extraordinary situation on your account. That is leverage.
The «March 2020» row. The figure is −112.0%. It is not a typo, and it does not mean you lost everything: it means you lost more than everything. The account goes below zero and you owe the broker the difference. Your capital is not your maximum loss — and that is the one thing almost no beginner knows when signing up.
The «only fear rises» row. I include this one for honesty, because it argues against my own case: if volatility spikes but the market does not move, you lose 4.1% and nobody asks you for anything. The strategy is not fragile to everything. It is fragile to exactly one thing: a market that falls fast.
You can be liquidated at a loss on a trade that would have ended fine.
This is the cruellest mechanism of all — and the only one you will not find explained on any sales page. It is worth understanding completely.
Back to the prudent version: the put sold at 6,950, 9.8% below the market. Imagine that mid-month the index drops 10%, to 6,937. Two things happen, simultaneously and in opposite directions.
What you would have lost in total, had you been able to wait for expiry
What you lose at that moment, because the option is valued at market prices
What the broker demands within hours — or it closes the position itself
The real loss of the trade, carried to expiry, would have been eighty-seven dollars. Practically nothing: one-fourteenth of a single month of premium. But the broker does not let you reach expiry, because two things happened in the meantime. And the result is that an $87 loss costs you $14,204: one hundred and sixty-three times as much.
First: the insurance you sold has become very expensive
Fear has exploded (in our scenario the VIX jumps from 15 to 33) and the price of buying your option back has spiked. You have not truly lost that money yet, but on the account it shows as a loss. It is as if your house were appraised on the day of the earthquake.
Second — and here is the real trap: the required collateral doubles
While the option was far from the market, the collateral was $70,695. Now that the market has come at it, the same option requires $119,456 of collateral. Your account is worth $85,796. You are $33,660 short.
So your capital falls precisely when the required collateral rises. The two curves cross — and when they cross, the broker does not call for advice: it closes. And it closes at the worst point, which is, by definition, the moment everyone is closing.
And now the part that truly hurts. I measured it on the real data since 1950: when the market touches −10% during a month, in 48.8% of cases it is back above that level by month-end. Almost one time in two, then, the forced liquidation turns a position that would have returned to profit into a permanent loss. You did not get the analysis wrong: you were thrown off the table while being right.
That is exactly why people who lost money with these methods almost all tell the same story, and it always sounds unbelievable: «the market never even reached my level, and they closed me anyway». It is not broker abuse. It is the normal functioning of a margin account, written into the contract you signed, applied to a position sized too large.
«The black swan comes once every ten years.» The data say otherwise.
I counted every one-month trading window from January 3, 1950 to August 19, 2026. That is 19,279 sessions. No estimates, no model: a direct count.
| If the market drops by… | Ends the month there | Touches it during the month | That is, roughly |
|---|---|---|---|
| 3% | 15.9% of months | 31.1% of months | every 3 months |
| 5% | 8.1% of months | 15.1% of months | every 7 months |
| 8% | 2.9% of months | 5.5% of months | every 18 months |
| 10% | 1.6% of months | 3.0% of months | every 2.7 years |
| 15% | 0.4% of months | 0.8% of months | every 11 years |
| 20% | 0.2% of months | 0.4% of months | every 24 years |
Look at the two middle columns, because the gap between them is the point. The «ends the month» column is what matters if you can wait for expiry. The «during the month» column is what matters for your account, because that is the one that triggers collateral calls. The second is systematically double the first.
A 5% dip during the month happens about every seven months. Not every ten years. And we saw two chapters ago that a 5% dip is already enough to trigger a $29,766 collateral call on the method’s most lucrative version.
The ten worst months in S&P 500 history
So they don’t stay an abstraction — here they are, with names and dates. Each row is a month in which whoever was selling puts without adequate protection stopped doing it.
| Starting on | The index did | Starting on | The index did |
|---|---|---|---|
| February 21, 2020 | −33.0% | June 21, 2002 | −19.4% |
| September 26, 2008 | −30.0% | August 16, 2001 | −18.3% |
| September 25, 1987 | −28.9% | July 8, 2011 | −16.7% |
| February 5, 2009 | −20.0% | April 27, 1962 | −16.3% |
| April 24, 1970 | −15.1% | August 14, 1974 | −15.0% |
Ten events in seventy-six years. That is one every seven and a half years — an average that hides the fact that they arrive in clusters: 2001 and 2002, 2008 and 2009. Whoever started in 2010 has seen two in fifteen years and concluded they are rare. Whoever started in 1999 saw four in ten.
The strategy works. The dose decides whether it enriches you or wipes you out.
Twenty thousand ten-year simulations on the months that actually happened since 1950 — this time with the mechanism that decides everything built in: if mid-month the account no longer covers the collateral, the broker liquidates and the loss is locked in. No fresh deposits: the situation of anyone with fixed capital.
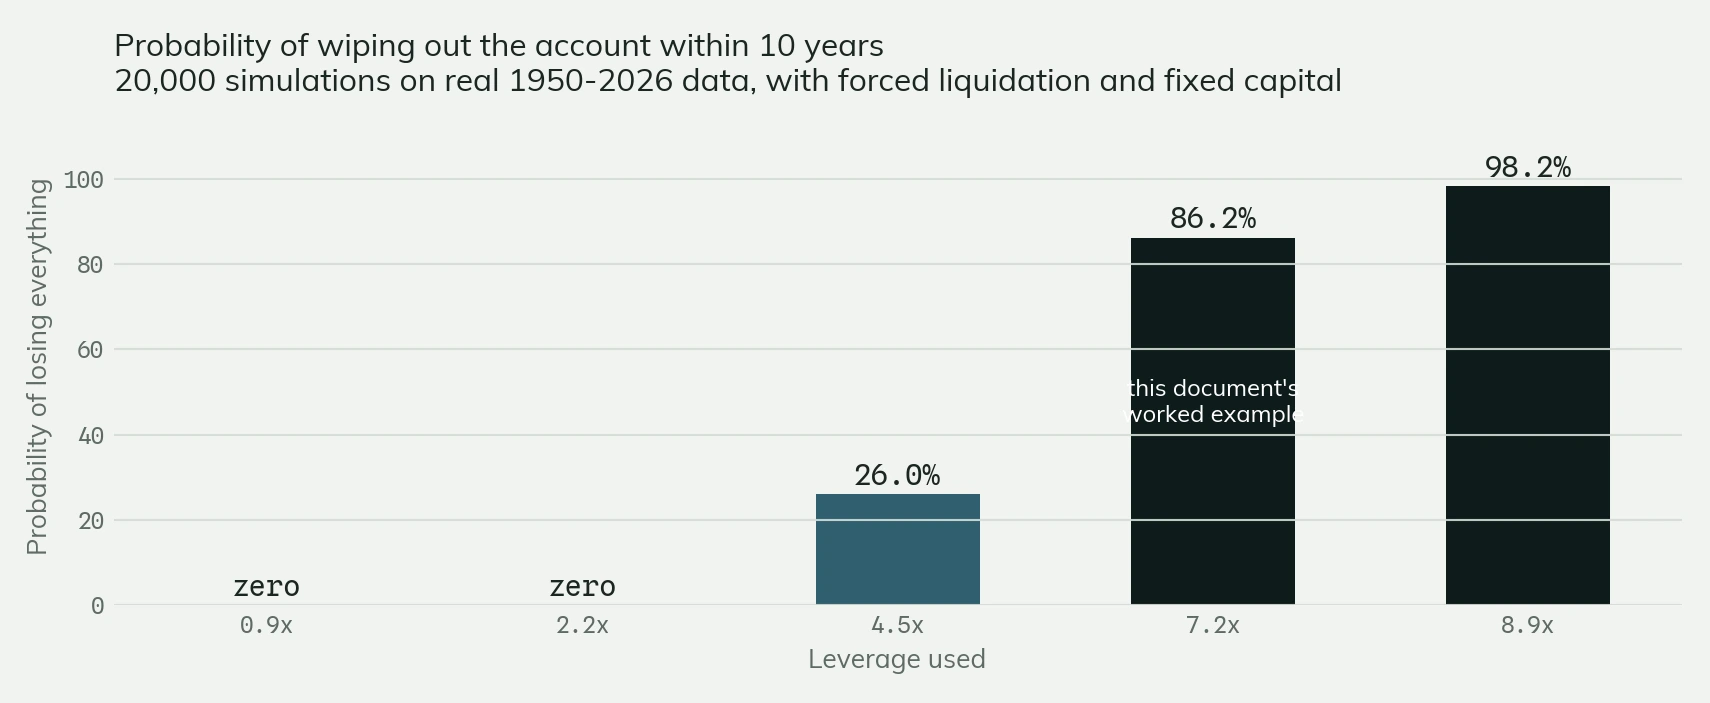
At full leverage, ruin is not a risk: it is the outcome. 98.2% of paths are wiped out within ten years, and one in five ends in debt to the broker. The culprit is not the rare crash but the frequent liquidation: with zero buffer the broker force-closes in 72% of months, each closure locks in a loss, and the account bleeds out before the hurricane arrives. Dosed at one quarter, the same strategy has zero ruin and returns a solid 11.9% a year: excellent — but not a monthly income.
| How I would dose it | Leverage | Risk of wipe-out | Realistic outcome |
|---|---|---|---|
| All capital posted as collateral | 8.9x | 98.2% | near-certain ruin; 1 in 5 in debt |
| As in the chapter 05 example ($100,000) | 7.2x | 86.2% | six paths out of seven wiped out |
| Half the capital | 4.5x | 26.0% | one in four wiped out |
| A quarter of the capital | 2.2x | near zero | 11.9% a year |
| A tenth of the capital | 0.9x | zero | 5% a year |
At full leverage, 98% of paths are wiped out. And the very few survivors hold, at the median, less than they started with: about $46,000 out of $100,000.
At this dose there is no good outcome.
So where do the glowing testimonials come from? From the calendar. They are sincere, and they are written in the first months, when almost everyone is in profit: one-year results and ten-year results are two different worlds, and the reviews all live in the first one. Those who blow up, later on, also stop talking.
To close the loop honestly
This strategy has a real mathematical edge, recognised by academic research: the Chicago exchange’s PutWrite index has replicated it without leverage since 1986, with returns similar to equities and smaller swings. It is not snake oil and it is not gambling.
But that edge is worth a handful of percentage points a year. Anyone promising to turn it into a monthly income is — without necessarily lying to you — selling you leverage. And leverage is not learned in a course: it is suffered, usually once.
Eight questions. If three go unanswered with a number, you have your answer.
They require no technical skill to ask, and there is no way to answer them vaguely without it showing. Bring them to the introductory call and take notes.
- What is the average leverage of your standard operating setup?
That is: notional value insured divided by capital committed. It is a pure number. Above 4, the conversation changes nature; above 8, you are buying a lottery ticket in reverse.
- Applying your position sizing, how much would I have lost on March 16, 2020, February 5, 2018 and April 7, 2025?
Three precise dates, three numbers. If the answer is that the alert system would have avoided the trade, ask for the signal log with timestamps — not the anecdote.
- Which broker, and with which instruments?
Real exchange-listed options, or contracts for difference, where the counterparty is the broker itself? Not a detail: in the second case, whoever sits across from you profits when you lose.
- Do you receive fees, commissions or rebates from the brokers you recommend?
Direct question, yes-or-no answer. A yes is not scandalous by itself, but it changes the weight of every subsequent piece of advice.
- Is there a certified track record of the founder on this strategy?
Broker statements, month by month — not screenshots. Anyone who has managed money professionally knows exactly what «verified track record» means, and how to produce one.
- Of your students, how many are still trading after twenty-four months, and with what median result?
Median, not mean: the mean is lifted by the lucky few. If you do not track the figure, say so — that too is precious information.
- Is my capital the maximum I can lose?
The correct answer is no. If they say yes, they have just failed the most important question of the very trade they teach.
- How much does it all cost, really, and for how many years?
Course, software, subscriptions, renewals, advanced modules. A single figure, in writing, before any commitment. And the refund terms — with which company, and in which court.
If after all this you still like the idea
That is a legitimate position, and there is nothing wrong with it. Two practical, free suggestions worth more than any course.
Never commit more than a quarter of your capital.
It is the only variable separating a 70-to-98-percent ruin from nearly zero. No other choice comes remotely close.
The pre-packaged version exists.
Listed instruments replicate the same strategy without leverage, at a yearly cost of around 0.3–0.5%. They return what the strategy truly returns. If that number no longer excites you, you have just discovered you were not buying a method: you were buying leverage. And that was free.
The document is the part you see. The work is the chain of calculation underneath.
The methodology note says where the numbers come from. This one says what they went through: two real market observations going in, 19,279 trading sessions to cross, twenty thousand ten-year paths coming out — and, at the end, the checks whose results do not help my case.
- 01
Two real observations
The chain starts small: two lines of the book of my broker, pulled on August 20, 2026 on the September 17 expiry. Strike 6,950, bid 11.80 and ask 12.10, implied volatility 24.1%; strike 7,325, bid 30.20 and ask 30.70, implied volatility 18.6%. The volatility curve used in the nine scenarios and in every simulation is calibrated on these two real observations, with the slope rescaled by the square root of the volatility level to avoid absurd extrapolation inside crisis regimes. The repricing is Black-Scholes for European index options, with a risk-free rate of 3.75% and a dividend yield of 1.15%. Four parameters and two lines of a book: with those, anyone can rebuild the nine-scenario table to the dollar.
- 02
The direct count
The other input is the index history from January 3, 1950 to August 19, 2026 — 19,279 sessions: daily S&P 500 closes, ticker ^GSPC, downloaded from Yahoo Finance on August 20, 2026. With one extra piece of honesty, because almost nobody declares it: before March 1957 the series continues backwards with the 90-stock S&P composite. It is the standard convention, but it should be said. There the frequencies are not estimated: every one-month trading window is counted, across six drop thresholds, and each one yields two separate columns — the level reached by month-end and the level touched during the month, which is systematically double the first and is the one that triggers collateral calls. From the same index history come the ten worst months, with dates and figures. Two more numbers are measured on the real data since 1950: a put sold 10% below the market expired worthless in 98.4% of months, and when the market touches −10% during a month, in 48.8% of cases it is back above that level by month-end.
- 03
The collateral rules
The collateral required is not a percentage picked by eye: it is the standard rule for broad-based index options — premium plus the greater of 15% of the index value minus the out-of-the-money amount, and 10% of the strike value. It comes back at three separate points: it sets how much capital each of the five strikes locks up, it produces the cash calls in the nine scenarios, and inside the simulations it decides whether and in which month the broker closes. Alongside it sits the advanced margin some brokers grant above a certain account size, estimated with the clearing houses' stress methodology: that is the $27,469 and 11.09% a month column in chapter 03. And it is worth saying, because the methodology note says it: actual requirements vary by broker and are frequently stricter than this.
- 04
Nine scenarios on a real account
On the single trade the calculation goes all the way: nine market configurations, a $100,000 account, fourteen days to expiry. Each row reprices the option at the new index level, the new volatility and the days remaining, starting from the premium actually collected in the market, and recomputes the collateral in parallel. Out come the two things that matter to anyone with money in the account: how much they lose, and how much they are asked to wire. The same two calculations produce the chapter 06 case, which in figures looks like this: $87 of loss if the trade could be carried to expiry, $14,204 of loss at market prices at that moment, collateral rising from $70,695 to $119,456, and $33,660 missing.
- 05
The historical premiums are reconstructed
This is the most exposed point in the whole exercise, so it goes up front. S&P 500 options have only been listed since 1983: the premiums of the preceding decades cannot be fetched from anywhere, and indeed I did not fetch them — I rebuilt them. Black-Scholes on the realised volatility of the previous twenty-one days, multiplied by 1.15, which is the historical margin a protection seller collects over the volatility that then actually arrived, with the same skew curve calibrated on today’s book. The monthly series comes from non-overlapping windows of twenty-one sessions: at each opening a put is sold 5% (or 10%) below the current level, expiring at the end of the window, rolled on the expiry day itself at the new level. That makes 915 months per variant. Two anchors make the reconstruction checkable rather than arguable: on today’s market the model premium matches the real one on the book, and at 1x leverage the series returns 5% a year, in line with the Chicago exchange’s PutWrite index, which has been doing exactly this without leverage since 1986.
- 06
Twenty thousand paths
Then the scale changes: twenty thousand ten-year paths, built by sampling six-month blocks of the months that actually happened, to preserve the clustering of turbulent periods instead of smoothing it away. Inside sits the mechanism that decides everything: every month the account is revalued at the worst point the market actually touched, with volatility inflated by the shock, and if it does not cover the collateral required at that moment the position is closed there, the loss is locked in, and the next month restarts with the remaining capital, with no fresh deposits. Ruin threshold at 25% of starting capital. The simulation runs across five doses, from 8.9x leverage down to 0.9x.
- 07
The checks that do not help my case
Three results are in the document even though they do not strengthen my conclusion. Transaction costs, measured to see whether the problem lived there: $25 on $3,045 of premium, i.e. 0.8% — so no, it does not. The industry’s loudest sales figure, verified rather than disputed: a put sold 10% below the market expired worthless in 98.4% of months since 1950, and that is accurate. And among the nine scenarios there is the «only fear rises» row, which the document flags for what it is: it argues against my own case, because if volatility spikes and the market does not move you lose 4.1% and nobody asks you for anything. The strategy is not fragile to everything. It is fragile to exactly one thing.
- 08
Where the model stays optimistic
Three assumptions play in favour of the strategy I am criticising, and they are written down: the worst point is measured on closing prices, while intraday lows are deeper; the volatility spike in crashes is calibrated below March 2020 levels; and the collateral used is the regulatory one, while brokers apply stricter house requirements and liquidate without notice. Then there are two variants computed on purpose. Strengthening the assumption on volatility spikes in crashes, full-leverage ruin moves from 98.2% to 99.1%, and the chapter 05 example from 86.2% to 90.9%. Removing forced liquidation — that is, imagining someone wiring fresh money at every collateral call — full-leverage ruin drops to 28–32%: the theoretical lower bound, not the reality of fixed capital, and it is published even though it weakens what I argue. The exact figure depends on the model; the substance does not.
What you download is nine chapters and a methodology note, in two languages. Underneath there are two real market observations, every one-month window counted across 19,279 sessions, nine scenarios repriced one by one, twenty thousand ten-year paths with forced liquidation built in, five doses and two variants. The PDF is the visible output, not the work. It is backtesting I could never have done without AI: a very long piece of work, born in a chat with Claude. That is why the note sits among the AI projects, and not only among the things I have written.
Where these numbers come from.
Every figure in this note is verifiable. Here are the sources, the calculation rules and — above all — the points where the model stays optimistic.
Market data
S&P 500 at 7,707.98 and VIX at 15.4, close of August 19, 2026. Index history from January 3, 1950 to August 19, 2026 — 19,279 sessions: daily S&P 500 closes (ticker ^GSPC) downloaded from Yahoo Finance on August 20, 2026. Before March 1957 the series continues backwards with the 90-stock S&P composite, as is conventional.
Option prices
Pulled directly from the book of my broker on August 20, 2026, September 17 expiry. On the 6,950 strike: bid 11.80, ask 12.10, implied volatility 24.1%. On the 7,325: bid 30.20, ask 30.70, implied volatility 18.6%. The repricing is Black-Scholes for European index options, with a risk-free rate of 3.75% and a dividend yield of 1.15%. The volatility curve used in scenarios and simulations is calibrated on these two real observations, with the slope rescaled by the square root of the volatility level to avoid absurd extrapolation inside crisis regimes.
Transaction costs
One check worth reporting because it disproves a reasonable suspicion: the bid-ask spread on these options is tiny — $25 on $3,045 of premium, i.e. 0.8%. The S&P 500 options market is among the most liquid in the world; trading costs are not the problem here. Everything to fear in this strategy lives in the leverage, not in the commissions.
Collateral requirements
Standard rules for broad-based index options: premium plus the greater of 15% of the index value minus the out-of-the-money amount, and 10% of the strike value. Advanced margin estimated with the clearing houses’ stress methodology. Actual requirements vary by broker and are frequently stricter.
Simulations
The monthly series that feeds everything comes from non-overlapping windows of 21 sessions: the put is sold 5% (or 10%) below the opening level, expires at the end of the window and is rolled on expiry day — 915 months per variant. The historical premiums are reconstructed with the model, because S&P 500 options have only been listed since 1983: Black-Scholes on the realised volatility of the previous 21 days multiplied by 1.15, with the skew described above. On that series run twenty thousand ten-year paths, built by sampling six-month blocks of the months that actually happened, to preserve the clustering of turbulent periods. The simulations include forced liquidation: every month the account is revalued at the worst point the market actually touched, with volatility inflated by the shock; if it does not cover the collateral required at that moment, the position is closed there and the loss is locked in, and the next month restarts with the remaining capital, with no fresh deposits. Ruin threshold at 25% of starting capital.
Where the model stays optimistic
Three assumptions remain optimistic: the worst point is measured on closing prices, while intraday lows are deeper; the volatility spike in crashes is calibrated below March 2020 levels; and the collateral used is the regulatory one, while brokers apply stricter house requirements and liquidate without notice. The no-liquidation version — someone wiring fresh money at every call — gives a 28–32% ruin at full leverage: it is the theoretical lower bound, not the reality of fixed capital.
Model check
At the lowest leverage it returns 5% a year, in line with the Chicago exchange’s PutWrite index, which has replicated this strategy without leverage since 1986. One predictable objection deserves an answer: volatility-regime filters («trade only when the gauges are calm») improve month selection but do not change the mathematics of the dose — February 2018, February 2020 and the days before April 2025 all started from low or normal volatility regimes.
A note on precision
Strengthening the assumption on volatility spikes in crashes, full-leverage ruin moves from 98.2% to 99.1%, and the chapter 05 example from 86.2% to 90.9%. The exact figure depends on the model; the substance does not. No number in this document should be read as a forecast to the decimal.
What this document is not
It is not financial advice, not a recommendation to make or avoid any trade, and not a judgement on any specific company or person. It is the technical description of how one precise options strategy behaves. Every investment carries risk, including the loss of all capital — and, in the specific case described here, beyond it. Before trading, assess your situation and, if needed, consult a licensed professional.
It is not the strategy that is dangerous — it is the dose.
The exact same trade, done with a quarter of the capital instead of all of it, goes from near-certain ruin to practically zero. No course is needed to understand this, and no course can replace it.
Nicola Giunchi · nicolagiunchi.it · August 2026